VOSviewer is a Misc AI tool. VOSviewer makes maps of networks. It helps you see connections between things like research papers or people. Key features include Network Visualization, Overlay Visualization, and Density Visualization. Best for data scientists and analysts, scientists and researchers and teachers.
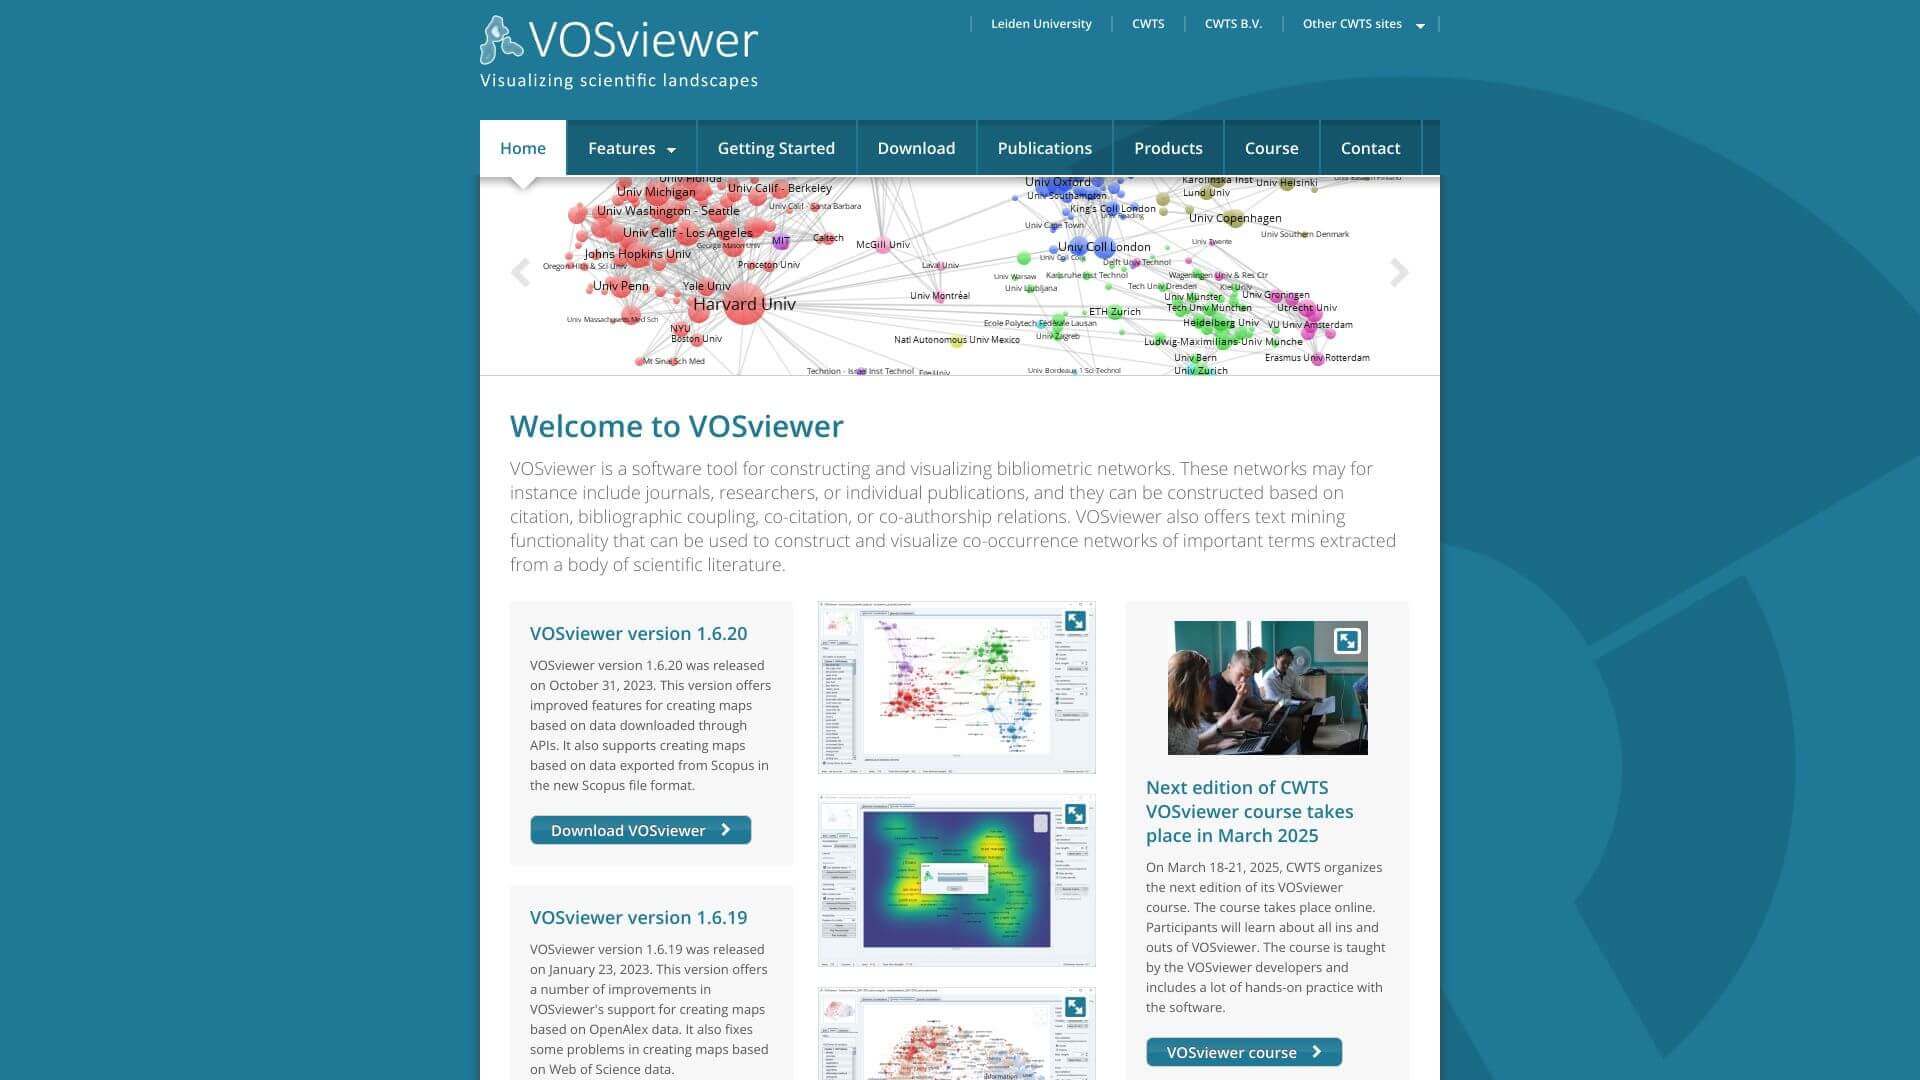
About VOSviewer
It's software that makes maps from data. Useful for seeing links in research, markets, or social groups. Free to use, it helps spot patterns and trends. It is a bit tricky to learn at first, and big files need lots of computer power. It works on Windows, Mac, and Linux!
Key Features
Network Visualization.
VOSviewer lets you see your data as a network. Think of it like a map of connected dots, where each dot is an item, and the lines show how they're related. It is an easy way to visualize various items and their connections.
Overlay Visualization.
This feature lets you add extra layers of information on top of your network map. It is like using different colored highlighters to show important details or patterns.
Density Visualization.
Shows you where things are clustered together most tightly in your data. If you want to find the hotspots in your data, this feature will show you. It highlights the most important relationships easily.
Zoom and Scroll Functionality.
You can dive deep into even the biggest maps thanks to this tool functionality,.
Customizable Weight and Score Attributes.
VOSviewer lets you decide which items in your network are most important by assigning scores to them; it is useful for focusing on specific networks.
API Integration.
It pulls data from places like Microsoft Academic and Crossref and even handles files from Web of Science and PubMed. So you can gather data from everywhere into a single useful analysis.
Frequently Asked Questions
VOSviewer lets you see your data in a few main ways: network visualization, overlay visualization, and density visualization.
Yes, VOSviewer is made to work with big sets of info. You can zoom in and scroll around to check everything out.
Since VOSviewer uses Java, it works on Windows, macOS, and Linux.
You can pull data into VOSviewer from places like Web of Science, Scopus, or through APIs like Microsoft Academic.