In a fast-moving business world, real-time data is critical for quick, informed decisions. AI-powered BI tools go beyond analyzing past data - they process live information to identify trends, anomalies, and patterns instantly. This article highlights five top tools for real-time analytics:
- Power BI: Offers live dashboards, AI-driven insights, and seamless integration with Microsoft tools.
- Tableau: Known for its intuitive visualizations and real-time updates with features like Tableau Pulse for instant notifications.
- Qlik Sense: Focuses on associative analytics, enabling deep exploration of data relationships with AI-driven insights.
- ThoughtSpot: Simplifies analytics with natural language queries and real-time processing from live data sources.
- KNIME: A no-code platform ideal for advanced analytics, with near real-time batch updates and strong integration options.
Quick Comparison
| Feature | Power BI | Tableau | Qlik Sense | ThoughtSpot | KNIME |
|---|---|---|---|---|---|
| Real-Time Processing | Live dashboards | Instant updates | Associative engine | Live data access | Near real-time batches |
| AI/ML Features | AutoML, anomaly detection | AI-driven insights | Predictive analytics | Natural language AI | Custom workflows |
| Visualization | Interactive dashboards | Drag-and-drop visuals | Dynamic dashboards | Search-based analytics | Visual workflows |
| Integration | Microsoft ecosystem | Broad third-party support | Cloud and database links | SaaS and legacy systems | 300+ data sources |
| Pricing | $10–$20/user/month | Starts at $15/user/month | Contact for details | Contact for details | Free (open-source) |
Each tool has unique strengths. Power BI is budget-friendly and integrates well with Microsoft products. Tableau excels in visuals, while Qlik Sense is great for exploring data relationships. ThoughtSpot simplifies analytics for non-technical users, and KNIME is perfect for teams needing advanced, customizable workflows.
When choosing, consider your team's skills, current tools, and whether you need instant insights or advanced analytics capabilities.
BI Analysis of BI Tools (The Most In-Depth Comparison of BI Tools)
1. Power BI
Microsoft's Power BI is a dynamic business intelligence platform that uses AI to provide real-time insights. Designed as a cloud-based tool, it makes handling live data streams and performing complex analytics more approachable, even for users without deep technical expertise.
Real-Time Data Processing
Power BI is built to deliver immediate insights by processing live data through advanced streaming capabilities. With real-time dashboards and instant analytics, it enables businesses to monitor critical metrics as they happen. It can pull updates from a variety of sources, including IoT devices, factory machinery, mobile apps, and websites. This means companies can track sales in real time, monitor equipment for potential issues, and spot sudden changes in key business areas.
The platform's Direct Lake technology connects directly to data lakes, cutting down on delays by eliminating the need for data duplication. Power BI offers three streaming models to suit different needs:
- Push semantic model: Handles up to 1 million rows per hour for full reports.
- Streaming semantic model: Caches data for up to one hour.
- PubNub streaming model: Reads live streams without storing the data.
AI and Machine Learning Features
Power BI leverages AI to simplify analytics and uncover hidden patterns in data. Its Q&A feature uses natural language processing, allowing users to ask questions in plain English and get instant answers. The Insights tool automatically detects anomalies and highlights key performance drivers. For deeper data exploration, tools like the Key Influencers and Decomposition Tree visuals make analysis more intuitive.
For users with Power BI Premium, AutoML simplifies the creation of machine-learning models, while Azure Cognitive Services expand capabilities to include text, sentiment, and image analysis. The platform's Anomaly Detection feature is particularly valuable for spotting unexpected trends quickly. This is critical, as 71% of organizations using streaming data systems prioritize real-time analytics.
Shaun Clowes, Chief Product Officer at Confluent, captures the importance of timely data analysis:
"At the end of the day, information has a decay rate. So think about customer feedback. It has a decay rate, or what your competitors are doing has a decay rate. So any new piece of data decays in its value to your decision-making very, very quickly."
Integration Options
One of Power BI’s strengths is its ability to integrate seamlessly with a wide range of data sources. It supports databases like SQL Server, MySQL, and Oracle; cloud platforms such as Azure, AWS, and Google Cloud; SaaS tools including Salesforce and Dynamics 365; and file formats like Excel, CSV, XML, and JSON. The DirectQuery feature allows real-time querying directly from these sources.
Additional integration options include Azure Stream Analytics, the Power BI REST API, and push datasets. These tools enable users to adjust semantic models on the fly without needing to republish them. This level of flexibility is essential, especially when data users spend up to 40% of their time simply trying to extract actionable insights. By streamlining these processes and using AI-powered dataflows to automate preparation, Power BI ensures businesses can make the most of their real-time data.
2. Tableau
Tableau simplifies the process of turning complex data into insights that drive action. Designed to cater to a wide range of users, it excels at converting real-time data into visual narratives that empower quick decision-making. Its capabilities are further strengthened by advanced real-time processing, AI-powered insights, and seamless integrations.
Real-Time Data Processing
Tableau connects directly to live data sources, ensuring dashboards are updated instantly for real-time decision-making. This eliminates the delays commonly associated with traditional batch processing methods.
With Tableau Pulse, the platform changes how organizations consume analytics. Instead of relying on users to check dashboards manually, Pulse delivers personalized insights directly where people work - whether through Slack, email summaries, mobile notifications, or Salesforce. This shift turns data into a proactive alert system, keeping teams informed without constant monitoring.
For example, a Fortune 500 retailer uses Tableau Pulse to keep their CFO and store managers updated. The CFO receives daily Slack alerts summarizing key financial metrics, like a notification stating, "Q2 margins dropped 3%, driven by an unexpected increase in transportation costs." Meanwhile, store managers get location-specific updates on daily sales and inventory, tailored to their responsibilities.
AI and Machine Learning Features
Tableau makes data analysis accessible to everyone with its AI-driven tools, including Tableau Agent, which automates tasks like data preparation, creating custom visualizations, and even suggesting relevant questions.
Tableau Pulse also uses AI to provide automated analytics in plain language, often anticipating questions users might not think to ask. A global financial services firm demonstrated the value of this feature when monitoring operating expenses. Their CFO received a Pulse digest highlighting a "new unfavorable trend" in travel expenses, which were 12% higher than usual due to increased international trips in Q2. The AI-generated explanation helped the finance team quickly identify the departments driving the spike and implement a policy review.
Other AI features, such as Data Stories, Explain Data, and Einstein Discovery, streamline workflows by reducing repetitive tasks and accelerating the time it takes analysts to uncover actionable insights.
Visualization Capabilities
Tableau's visualization engine turns raw data into user-friendly dashboards through a simple drag-and-drop interface. This makes it easy for users to create reports that drive decisions. Dashboards connected to live databases update automatically, ensuring users always see the most current information.
Key features include data blending, which combines information from multiple sources into a single view, built-in calculated fields for custom formulas, and interactive filters that let users tweak dashboards dynamically. Plus, dashboards automatically adjust to any device, offering flexibility for users on the go.
US Auto Parts, an internet retailer, showcases these capabilities by using Tableau to analyze everything from product sales to email marketing performance. Their category managers can filter data by time period, sales channel, or website, and then drill down into details like product subcategories and SKUs. Sarah Gustafson, VP of Business Analytics at US Auto Parts, shared how Tableau has impacted their workflow:
"Tableau has saved hours and hours of time pulling and manipulating data so we can focus more time on the activities that really matter - analyzing the data and serving up discoveries and recommendations to move the business forward."
With its intuitive interface and real-time updates, Tableau streamlines data visualization for actionable insights.
Integration Options
One of Tableau's standout features is its ability to connect with virtually any data source, from traditional databases to modern cloud platforms and streaming data sources. This ensures real-time analytics and automatic dashboard updates.
HelloFresh highlights the benefits of Tableau's integration capabilities. By automating reporting processes with Tableau, their digital marketing team saved 10 to 20 working hours per day. This freed up time to focus on creating more targeted and segmented marketing campaigns.
Ryan Aytay, President & CEO of Tableau, reflects on the platform's evolution:
"At Tableau, we're committed to helping people make real-time, data-driven decisions powered by generative AI. As we enter the agentic era, every role - from data analysts to site admins - is evolving. Our tools must evolve too, alongside our people and organizations."
3. Qlik Sense
In a world where real-time data processing is becoming increasingly critical, Qlik Sense steps up with advanced AI features designed to meet modern needs. At the heart of the platform is an associative analytics engine that goes beyond the limitations of traditional query-based dashboards. While other tools focus on detailed AI and machine learning capabilities, Qlik Sense refines real-time analytics with its unique engine. Its combination of powerful AI tools and user-friendly data visualization makes sophisticated analytics accessible to everyone, regardless of their technical background. This approach allows organizations to uncover hidden insights and make informed predictions that drive strategic decisions.
AI and Machine Learning Features
Qlik Sense integrates AI and machine learning across its platform, giving users access to automated insights and predictive tools. Key features include:
- Automated insight generation and natural language interaction for intuitive data exploration.
- AI-assisted tools for creating and preparing data.
- Advanced AutoML capabilities to simplify machine learning workflows.
With Qlik AutoML, teams can build machine learning models without writing a single line of code. This streamlines the process of selecting, training, and optimizing models.
Qlik Predict speeds up predictive analytics, delivering measurable improvements across various industries.
Meanwhile, Qlik Answers acts as a generative AI assistant, merging analytics with unstructured content to provide insights that are easy to understand. Its use of natural language processing and generation ensures clarity, even when addressing complex queries.
"We're excited about the potential to leverage Qlik Insight Advisor to enhance customer satisfaction through deeper sentiment analysis, and Qlik AutoML for predictive trends that will help us engage our customers in new ways."
Dan Williams, Business Intelligence Manager at PizzaExpress, shared his thoughts on how Qlik Sense is transforming their approach to customer engagement.
Visualization Capabilities
Qlik Sense’s associative analytics engine allows users to uncover hidden data relationships with ease. Its AI-driven features automatically generate insights and recommendations based on natural language queries, helping users identify trends and anomalies. Interactive dashboards dynamically update as selections are refined, offering a complete view of both related and excluded data for deeper analysis.
Integration Options
Qlik Sense doesn’t just excel in visualization - it also connects seamlessly to a wide range of data sources. It supports databases, cloud warehouses like Snowflake, Google Cloud BigQuery, and Azure Synapse Analytics, as well as web-based sources and REST APIs. The platform also enables application integration, allowing data to move and sync between systems, and offers automation tools to create workflows that respond to business events.
For deployment, Qlik Sense Enterprise provides flexibility with multi-cloud and on-premises options. Data connections are securely managed through the Qlik Sense Repository Service, ensuring reliable access across an organization.
"By building AI into everything they deliver, while still maintaining a cloud-agnostic approach, Qlik is meeting customers where they are in their AI journey while providing the flexibility needed to expand AI where and how it makes sense."
Dan Vesset, Group Vice President at IDC, highlighted Qlik’s ability to adapt to customer needs and provide scalable AI solutions.
sbb-itb-212c9ea
4. ThoughtSpot
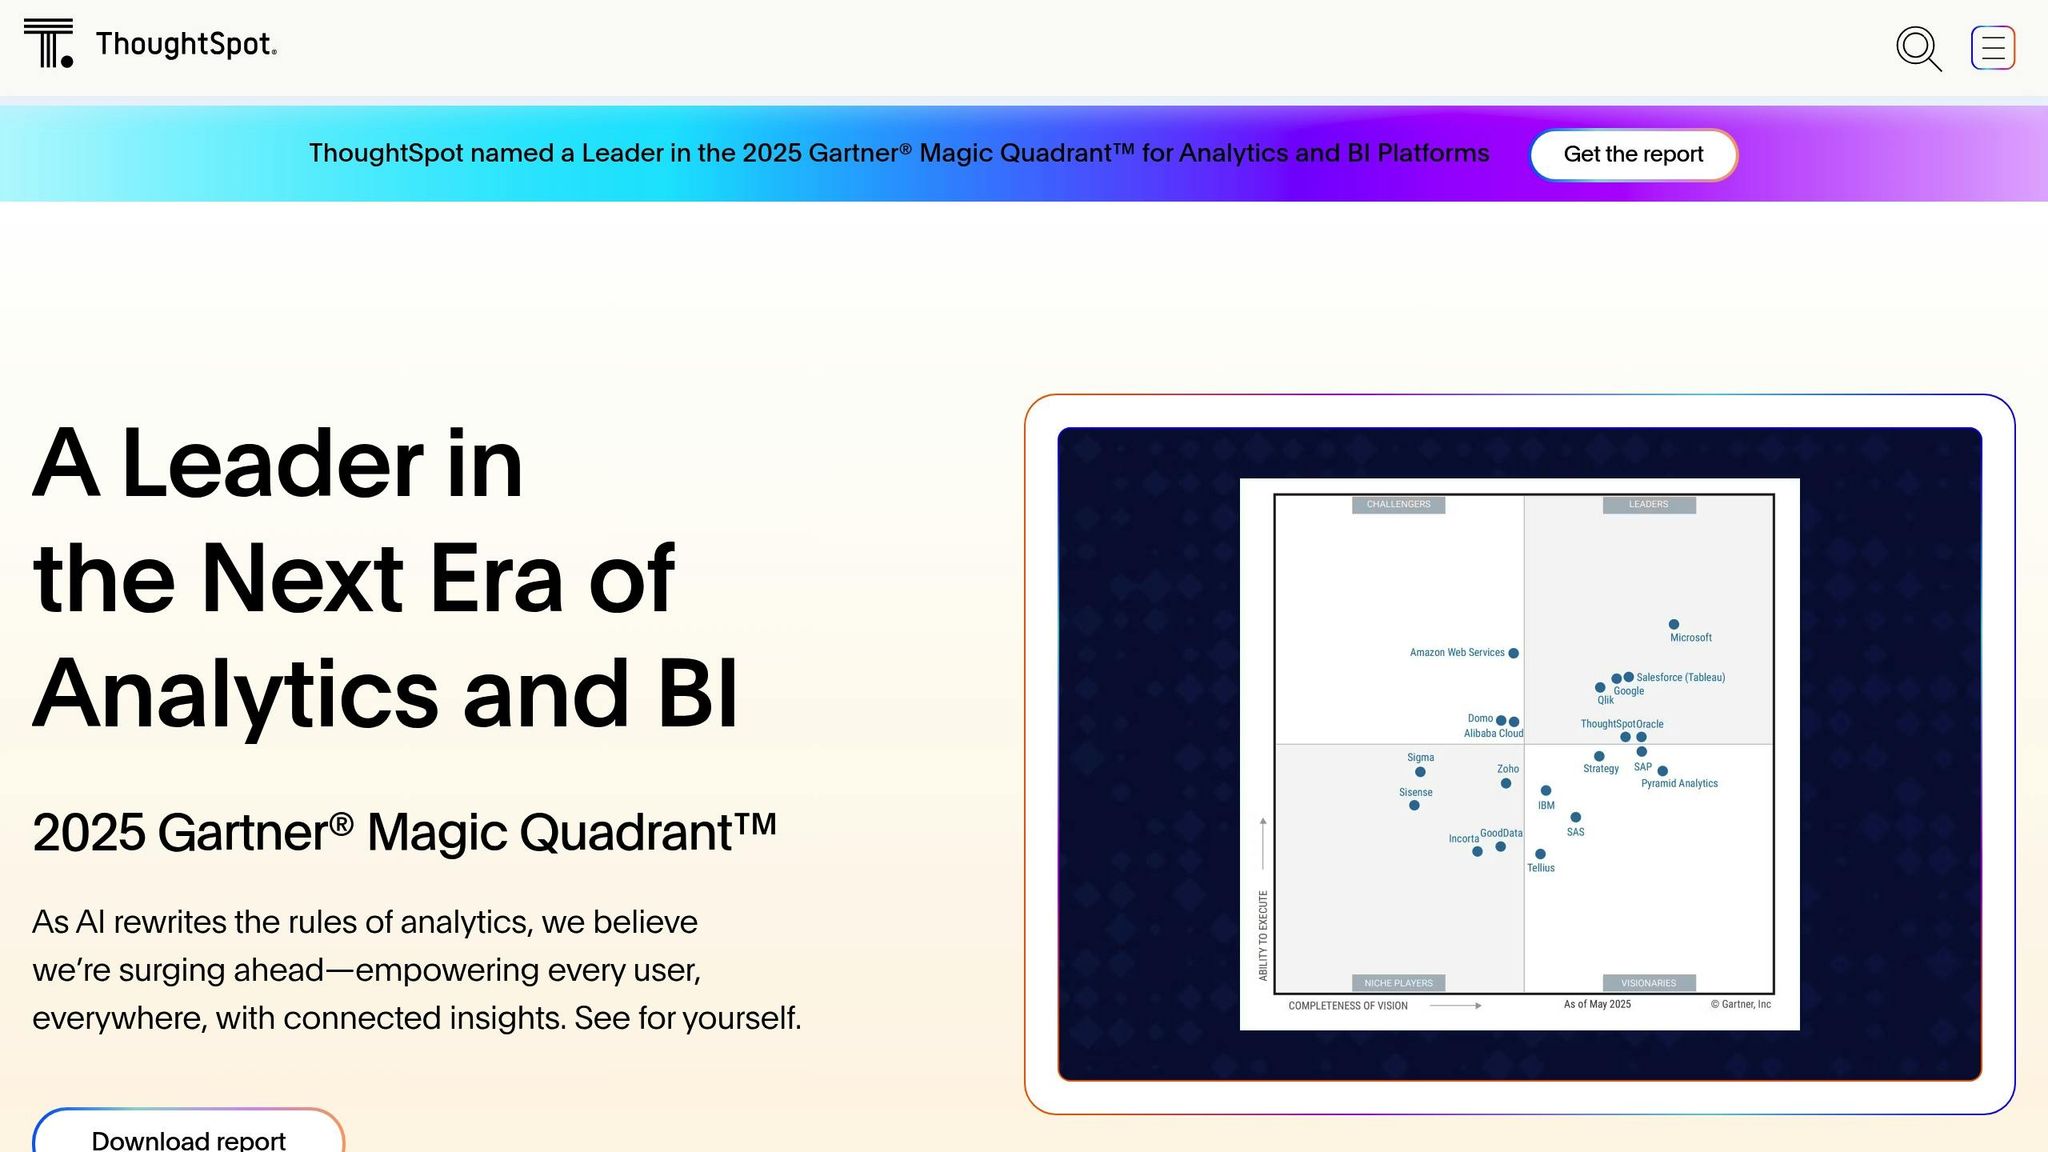
ThoughtSpot is a search-driven analytics platform designed to simplify data queries using plain English. Unlike traditional BI tools that often require technical know-how, ThoughtSpot enables users to ask questions in natural language and get immediate, actionable insights. It prioritizes quick data access and user-friendly analytics, delivering real-time insights through its search-driven approach.
Real-Time Data Processing
One of ThoughtSpot's standout features is its ability to process real-time data by directly connecting to live sources. This means users can make decisions based on data that's only seconds or minutes old. As a technical content writer at ThoughtSpot put it:
"Real-time analytics gives you access to current data so that you can make quick, informed decisions."
With Live Analytics, users can instantly explore both real-time and cached data without needing extensive preparation. For example, Canadian Tire used these timely insights to boost sales by 20% during the COVID-19 pandemic.
AI/ML Features
ThoughtSpot takes analytics a step further by integrating AI to uncover deeper insights. Its SpotIQ feature automatically identifies patterns, while the AI Analyst Spotter tackles complex business questions and presents answers with clear visualizations. Additional tools like Change Analysis and AI Highlights help teams detect anomalies and trends faster, enabling more proactive decision-making. Neobank Northmill used these AI-powered insights for customer segmentation, which led to a 30% increase in conversions.
Integration Options
ThoughtSpot connects effortlessly with a wide range of data sources, including cloud data warehouses, legacy databases, files, and SaaS applications. It integrates with popular platforms like Amazon Redshift, Google BigQuery, Snowflake, Azure Synapse, and Databricks, as well as traditional databases such as Oracle, MySQL, PostgreSQL, and SQL Server. Additionally, it works with tools like dbt, GitHub, and Google Sheets.
For organizations focused on data governance, ThoughtSpot supports catalog tools like Alation, Atlan, and Collibra to ensure data lineage, quality, and compliance. The platform offers flexibility with live query and cached dataset options, and its REST APIs enable custom integrations and automated workflows. This versatility makes ThoughtSpot suitable for organizations at various stages of their data journey.
5. KNIME
KNIME is an open-source platform designed for data analytics and machine learning, offering a no-code, drag-and-drop interface to build workflows. Unlike many traditional BI tools, KNIME prioritizes advanced analytics, making it accessible to users without programming expertise. While coding is optional, users can incorporate custom code when needed, allowing flexibility for more complex tasks.
Real-Time Data Processing
When it comes to real-time data processing, KNIME leans more toward near real-time batch updates rather than instant data streaming. A KNIME team member confirmed that no recent improvements have been made to its real-time capabilities.
KNIME handles near real-time updates using looped workflows with predefined cycle durations. For businesses that require true real-time execution, KNIME Business Hub steps in with API-triggered workflows. This feature allows external systems to activate workflows based on real-time events. However, compared to platforms with Direct Query features, KNIME remains more suitable for batch processing and scheduled analytics.
Despite these limitations, KNIME's AI tools help simplify and streamline complex analytics, making it a powerful option for data-driven organizations.
AI/ML Features
KNIME stands out in the AI and machine learning space with a robust toolkit designed to simplify advanced analytics. Its K-AI assistant can create entire data science workflows, generate visualizations, and produce code snippets - all from simple text prompts.
The platform also supports Large Language Models (LLMs), enabling capabilities like text generation, sentiment analysis, and summarization. Users can build, train, and evaluate machine learning models - including decision trees, clustering algorithms, and neural networks - through its intuitive visual interface.
Several organizations have achieved impressive results with KNIME. For instance:
- BGIS saved $400,000 annually by automating work order parsing.
- Audi cut costs by $30,000 through supply chain process automation.
- The US Food and Drug Administration saved hundreds of hours yearly by leveraging KNIME's AI-powered workflows.
Allan Luk, Director of Data Science and Analytics Business Solutions, highlights the platform's ease of use:
"KNIME is easy to learn and adopt and is an integral part of our corporate Citizen Data Scientist training program. We've had engineers go from complete beginners to analytics practitioners within a few months."
Integration Options
KNIME complements its analytics features with extensive integration capabilities. The platform connects to over 300 data sources, including SQL databases, cloud storage, and SaaS platforms. Pre-built connectors for major cloud services - like Google Cloud, Snowflake, Amazon S3, and Microsoft Azure - make data access straightforward, even for users with limited SQL knowledge.
KNIME also supports multiple programming languages, such as Python, R, SQL, Java, and C, allowing teams to integrate existing code libraries into their workflows without sacrificing the no-code approach. Additionally, it integrates seamlessly with other BI tools, such as Microsoft Power BI, enabling users to push processed data directly into Power BI datasets.
Database connectivity is enhanced through JDBC drivers, with dedicated connector nodes that include built-in drivers and user-friendly configuration dialogs. For secure data handling, the Credentials Configuration node ensures proper authentication across various data sources - an essential feature for workflows deployed on the KNIME Community Hub.
Mayank V., a Software Engineer, underscores the platform's integration strengths:
"The vast number of nodes available in KNIME offers excellent flexibility and coverage for almost all types of business challenges. It also provides excellent connectivity and integration with different platforms."
Feature Comparison Chart
Here's a comparison of the core features of five leading AI-powered BI tools:
| Feature | Power BI | Tableau | Qlik Sense | ThoughtSpot | KNIME |
|---|---|---|---|---|---|
| Real-Time Data Processing | Live data monitoring with interactive dashboards | Real-time data analysis with interactive visualizations | Flexible, in-memory data exploration | AI-driven insights with natural language querying | Near real-time batch updates |
| AI/ML Features | Generative AI for insights, report summaries, DAX queries, and interactive Q&A | Einstein and GPT integration for natural language queries and predictive analytics | Automated machine learning for self-service analytics | Built around search and GPT-driven natural language querying | Custom workflows and visual model building |
| Visualization Options | Interactive dashboards with Microsoft ecosystem integration | High-quality visual analytics and user experience | Associative engine for flexible data discovery | Search-driven analytics interface | Drag-and-drop visual workflows |
| Integration Capabilities | Seamless integration with Microsoft tools, balancing self-service and enterprise BI | Strong third-party integrations, focusing on visual analytics | Associative engine for connecting diverse data | Natural language search for easy analytics access | Wide-ranging integration capabilities |
| Pricing | $10–$20 per user/month | Viewer: $15 per user/month (billed annually) | Contact for pricing | Contact for pricing | Open-source (free); Business Hub for enterprise |
| Overall Rating | 4.5/5 – Highly rated for features and ease of use | 4.3/5 – Recognized for interactive visual analytics | Strong in associative analytics | Excellent for making analytics accessible | Ideal for advanced analytics and data science |
This table offers a quick overview of each platform's capabilities, helping you identify the best fit for your needs.
Power BI strikes a balance between affordability and functionality, making it a great choice for organizations already invested in Microsoft products. Tableau stands out with its superior visual analytics and user experience, although it comes at a higher price. Qlik Sense is unique for its associative engine, which allows users to explore data connections seamlessly.
ThoughtSpot simplifies analytics for non-technical users with its search-based interface, while KNIME is perfect for teams requiring advanced analytics and custom workflows. Its open-source model is especially appealing to budget-conscious teams with technical expertise.
The importance of selecting the right BI tool can't be overstated. With 67% of the workforce relying on these tools and decision-making now up to five times faster, the BI market is projected to surpass $33 billion by 2025.
When deciding, consider your team's technical skills, your current software ecosystem, and your specific needs. For those needing instant insights, real-time processing should be a top priority. Meanwhile, teams focusing on advanced analytics may find KNIME's machine learning capabilities more suitable.
Conclusion
AI-powered BI tools have transformed how businesses handle real-time data analysis and decision-making. The results speak for themselves: AI prediction models can reduce decision-making times by up to 90%, and natural language search capabilities lessen reliance on technical teams by 40%. These aren't just incremental changes - they represent a fundamental shift in how organizations operate.
Take Procter & Gamble, for example. In June 2022, the company adopted IBM Watson AI for supply chain monitoring, which led to a 37% reduction in inventory discrepancies and saved $12 million by avoiding costly errors. Similarly, Pfizer accelerated drug launch timelines by 40% by leveraging real-time market sentiment data, while Walmart improved its supply chain response times by an impressive 68%.
The automation features alone make these tools worth the investment. Monthly report automation can save up to 35 hours, and AI monitoring systems can catch 93% of errors. Financial institutions, for instance, have used these advancements to shrink credit approval times from 48 hours to just 15 minutes - all while maintaining a 99.3% accuracy rate. These efficiencies pave the way for smarter, faster, and more strategic decision-making.
When choosing a BI tool, start by identifying your business needs and ensuring the solution integrates seamlessly with your existing data sources. Factor in both upfront and long-term costs, such as licensing fees and ongoing support. Focus on a few high-impact use cases rather than trying to address every challenge at once.
Looking ahead, the potential for these tools continues to grow. By 2025, it’s predicted that half of all analytics queries will rely on natural language processing. By 2026, 60% of reports could be fully autonomous, featuring self-healing formats and contextual narratives. Businesses that invest in the right tools today will be well-positioned to harness these advancements tomorrow.
Ultimately, success lies in matching the tool to your technical capabilities, ecosystem, and growth objectives. Whether your priorities include real-time data processing, advanced analytics, or intuitive interfaces, the right solution should deliver measurable benefits from day one. This is why top AI BI tools remain essential for gaining real-time insights and staying competitive in a rapidly evolving landscape.
FAQs
How do AI-powered BI tools improve real-time data processing compared to traditional BI tools?
AI-driven BI tools revolutionize real-time data analysis by using advanced algorithms and machine learning to process massive datasets almost instantly. Unlike older BI tools that rely on batch processing and historical data, these tools handle live data streams, delivering instant insights that support quicker, smarter decision-making.
With this real-time functionality, businesses can adapt swiftly to changing conditions, fine-tune operations, and anticipate trends more effectively. By cutting down on delays and delivering actionable insights right when they're needed, AI-powered BI tools empower organizations to operate with greater speed and precision.
What should businesses look for when selecting the best AI BI tool for real-time data insights?
When deciding on an AI-powered BI tool, it's important to align the choice with your company's specific needs and goals. Pay close attention to factors like how easy the tool is to use, its ability to integrate with your current systems, scalability to grow with your business, and overall cost-efficiency.
Look for features that truly matter, such as real-time analytics, dashboards you can customize to suit your needs, and robust security protocols to protect your data.
Also, think about whether the tool can grow alongside your business and if the vendor provides dependable support when you need it. Matching the tool's capabilities to your business objectives can help you gain valuable insights and make more informed decisions.
How do AI and machine learning features in BI tools enhance decision-making and analytics?
AI and machine learning are transforming business intelligence tools by automating data analysis, spotting patterns, and offering insights in real time. This means businesses can now process massive amounts of data quickly and identify trends that might go unnoticed with older, manual methods.
With predictive insights and enhanced data precision, these tools empower organizations to make smarter, forward-thinking decisions. This not only allows for quicker reactions to market shifts but also strengthens strategic planning efforts.

