
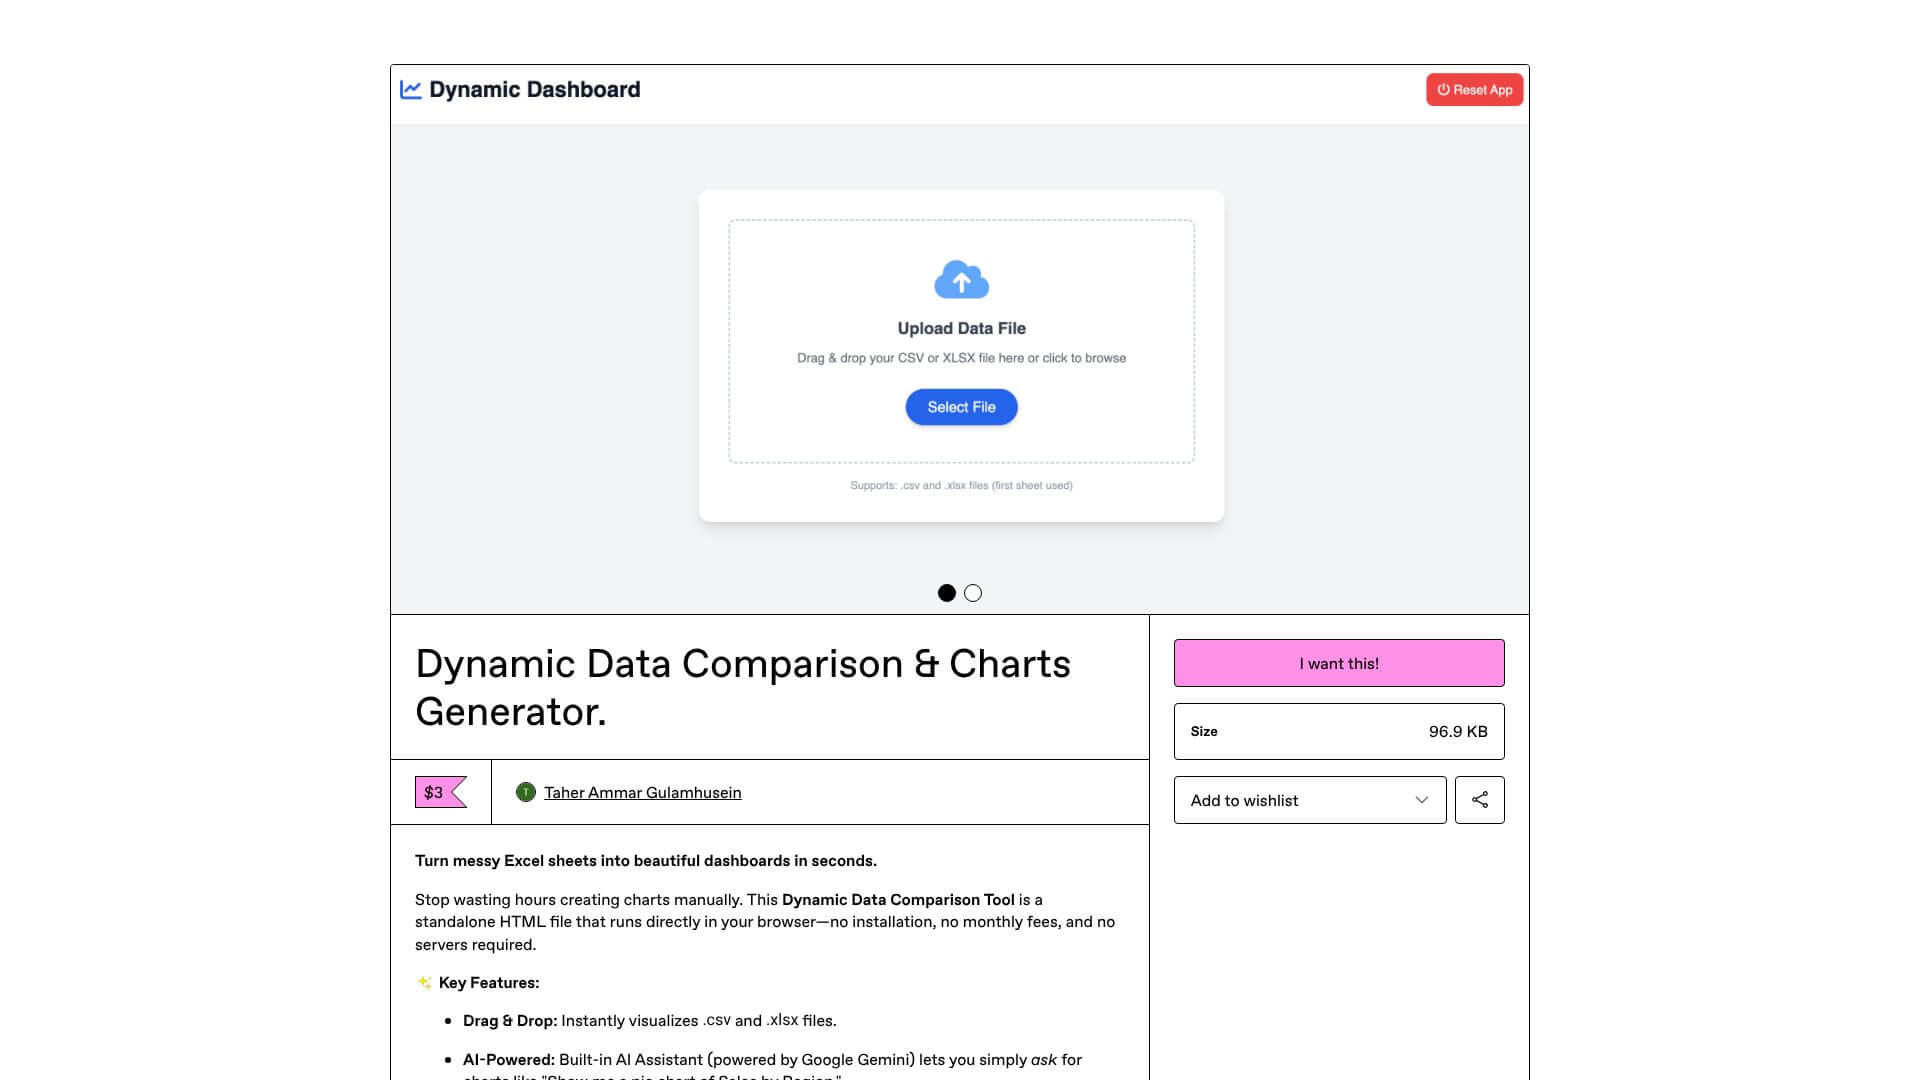
Dynamic Data Comparison Tool is an AI Productivity tool. Compares data visually to instantly show differences and trends, no tech skills needed. Key features include Dynamic Data Visualization, Multi-Source Data Integration, and Customizable Comparison Layouts. Best for data scientists and analysts, business consultants and marketers.
About Dynamic Data Comparison Tool
Key Features
Dynamic Data Visualization.
Multi-Source Data Integration.
Customizable Comparison Layouts.
Real-Time Updates.
Export and Sharing Capabilities.
User-Friendly Interface Design.
Frequently Asked Questions
The Dynamic Data Comparison Tool makes visualizations and formatting that Excel needs manual setup for. It cuts down time from hours to minutes. It also makes more professional results that are great for presentations.
Yes, real-time update features mean your comparisons will show data changes without you having to remake them. How much can be automated depends on how your data source connects.
No, the tool has a drag-and-drop interface and templates. These are made for people who aren't technical. You don't need to know how to program.
The tool works with common formats like CSV and Excel. It also takes structured data from popular business apps. You should check the product details for all supported formats.